MACD, short for moving average convergence/divergence, is a trading indicator used in technical analysis of stock prices, created by Gerald Appel in the late 1970s. It is supposed to reveal changes in the strength, direction, momentum, and duration of a trend in a stock’s price.
The MACD indicator (or “oscillator”) is a collection of three time series calculated from historical price data, most often the closing price. These three series are: the MACD series proper, the “signal” or “average” series, and the “divergence” series which is the difference between the two. The MACD series is the difference between a “fast” (short period) exponential moving average (EMA), and a “slow” (longer period) EMA of the price series. The average series is an EMA of the MACD series itself.
The MACD indicator thus depends on three time parameters, namely the time constants of the three EMAs. The notation “MACD (a, b, c)” usually denotes the indicator where the MACD series is the difference of EMAs with characteristic times a and b, and the average series is an EMA of the MACD series with characteristic time c. These parameters are usually measured in days. The most commonly used values are 12, 26, and 9 days, that is, MACD (12, 26, and 9). As true with most of the technical indicators, MACD also finds its period settings from the old days when technical analysis used to be mainly based on the daily charts. The reason was the lack of the modern trading platforms which show the changing prices every moment. As the working week used to be 6-days, the period settings of (12, 26, and 9) represent 2 weeks, 1 month and one and a half week. Now when the trading weeks have only 5 days, possibilities of changing the period settings cannot be overruled. However, it is always better to stick to the period settings which are used by the majority of traders as the buying and selling decisions based on the standard settings further push the prices in that direction.
A fast EMA responds more quickly than a slow EMA to recent changes in a stock’s price. By comparing EMAs of different periods, the MACD series can indicate changes in the trend of a stock. It is claimed that the divergence series can reveal subtle shifts in the stock’s trend.
Since the MACD is based on moving averages, it is inherently a lagging indicator. As a metric of price trends, the MACD is less useful for stocks that are not trending (trading in a range) or are trading with erratic price action.
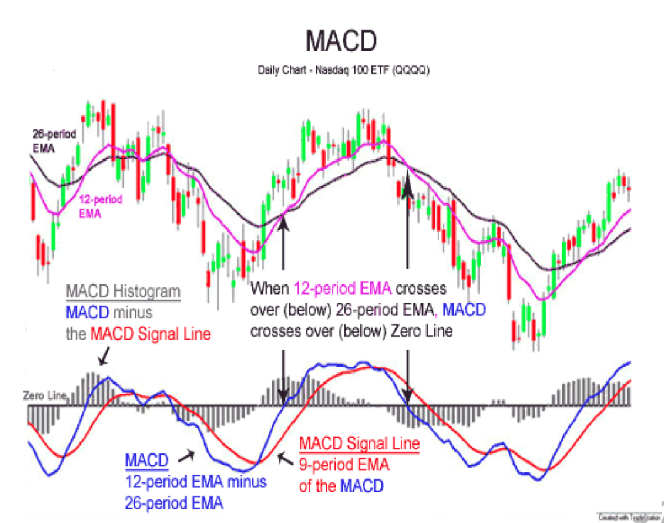
MACD Crossovers
As shown on the following chart, when MACD falls below the signal line, it is a bearish signal indicating that it may be time to sell. Conversely, when MACD rises above the signal line, the signal is bullish, suggesting that the asset’s price might experience upward momentum. Crossovers are more reliable when they conform to the prevailing trend. If MACD crosses above its signal line after a brief downside correction within a longer-term uptrend, it qualifies as a bullish confirmation and the likely continuation of the uptrend.
Is MACD a Leading Indicator or a Lagging Indicator?
MACD is a lagging indicator. The data used in MACD calculation is based on the historical price action, therefore MACD readings lag the price. However, some traders use MACD histograms to predict when a change in trend will occur. For these traders, this aspect of MACD might be viewed as a leading indicator of future trend changes.

Key Takeaways
- Moving average convergence/divergence (MACD) is a technical indicator to help investors identify entry points for buying or selling.
- The MACD line is calculated by subtracting the 26-period exponential moving average (EMA) from the 12-period EMA.
- The signal line is a nine-period EMA of the MACD line.
- MACD is best used with daily periods, where the traditional settings of 26/12/9 days is the default.