Gaps are empty space on charts where no trading has occured.
There are 2 types of gaps:
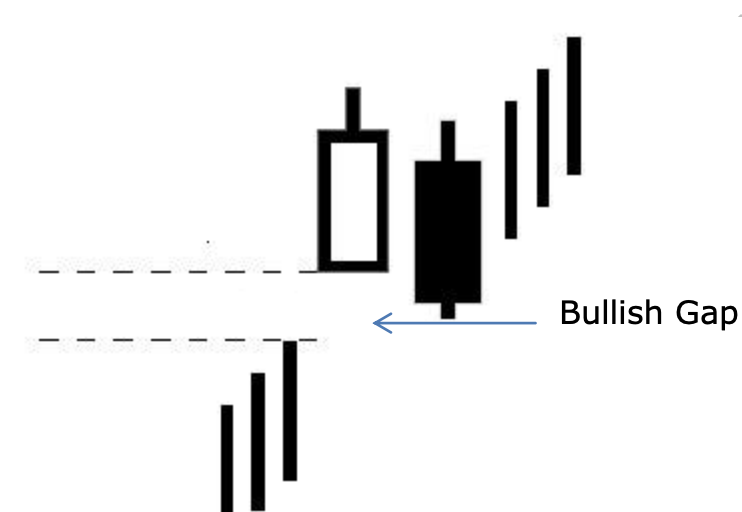
- Upward Gap: Where today’s low is greater than yesterday’s high, it results in Upward gap or rising gap or Bullish gap.
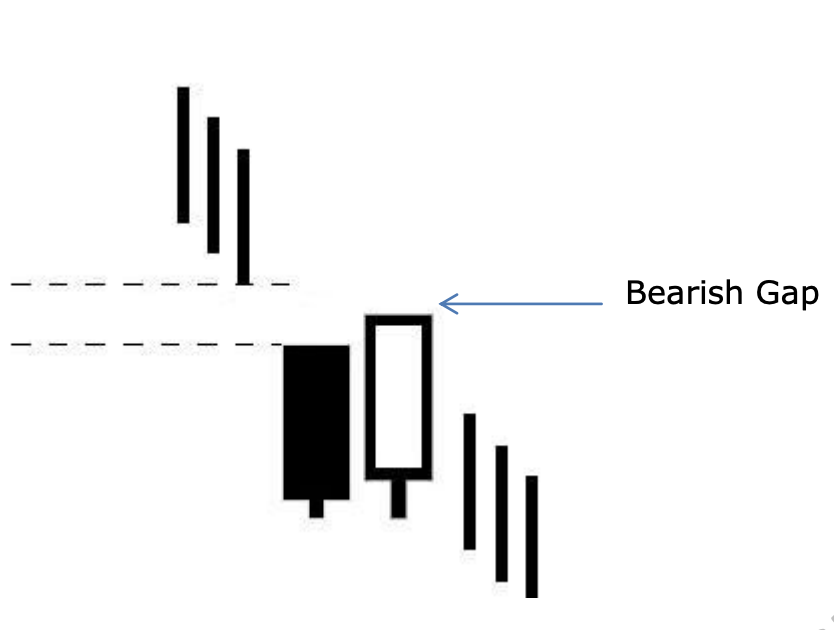
2. Downward Gap – where today’s high is lesser than yesterday’s low, it results in downward gap or falling gap or bearish gap.
Characteristics of Gaps
- When prices open with a gap-up with respect to previous days close, it is a gap up opening & vice versa for gap down opening.
- A gap-up opening need not result or translate into a rising gap and vice versa.
- A gap occuring on a higher time frame chart would hold greater significance i.e. a weekly gap will hold more significance than a daily gap.
- They also act as support & resistance.
Exhaustion of Gaps
This gap occurs at the end of the rally where volumes will be high and the gap will be accompanies with beairsh candle stick formation.
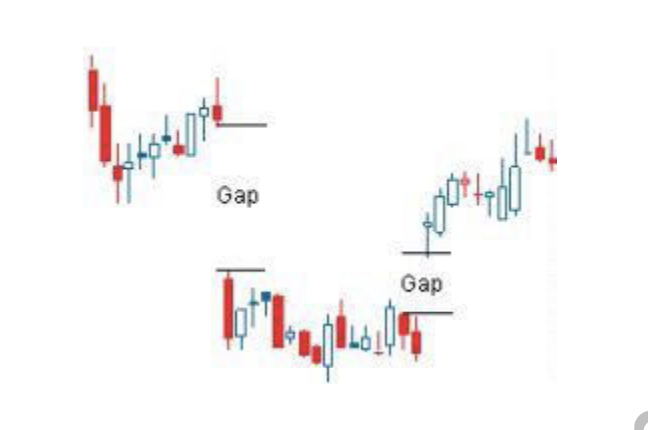
Note – Arally may even have no gaps and sometimes it can have more than 1 gap.
Island Reversal
When a group of bars are seperated by gap’s on both the sides it results in island reversal pattern.

When trend reverses from down to up it forms a bullish island reversals pattern.
– A bullish island reversal is an signal to buy with a stop loss as lowest of the island.
When trend reverses from up to down it forms a bearish island reversal pattern.
– A bearish island reversal is a signal to sell with a stop loss as high of island.
Moving Averages
There are two types of moving averages:
- Simple Moving Averages ignores past data completely. SMAs are used for longer term periods.
| Days | Closing |
| 1 | 73 |
| 2 | 76 |
| 3 | 78 |
| 4 | 80 |
| 5 | 79 |
| SUM TOTAL | 386 |
| 5 DAY DMA | 77.2 |
2. Exponential Moving Averages – these do not completely ignore past data. EMAs are used for short term periods.
Formula
Exp Factor = 2/(n+1) where n = no.of days
EMA = (Closing – Previous EMA)*Exp Factor + Previous EMA
| Days | Closing | EMA |
| 1 | 73 | |
| 2 | 76 | 73.99 |
| 3 | 78 | 74.65 |
| 4 | 80 | 75.31 |
| 5 | 79 | 74.98 |
Characteristics of Simple Moving Averages
- They are one of the most simple yet effective tool of technical analysis. They smoothen out random small fluctuation in price and thereby make decision making easy.
- Moving averages are very good trend identifying devices.
a. Short term trend 21 DMA / 34 DMA
b. Medium tern trend 55 DMA / 89 DMA
c. Long term trend 144 DMA / 234 DMA - Moving avergaes are very good trend following devices in a trending market
- They are laggards
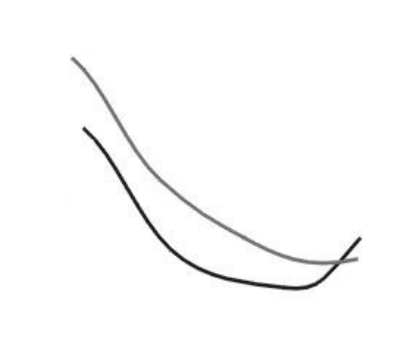
- They are like curved trend lines superimposed on charts
- It provides dynamic suport and resistance
- They are used for generating buy and sell signals
- Moving average when breached reverse their roles
- Higher period moving averages are more reliable
Crossover of Moving Averages
Double Crossover – when small moving averages cuts higher moving average from below a buy signal is generated and vice versa for sell
Pairs used for trading
3 & 15 EMA
5 & 13 EMA
5 & 20 EMA
5 & 21 EMA
7 & 13 EMA
7 & 21 EMA
13 & 34 EMA