There are three types of analysis
1. Technical Analysis
2. Fundamental Analysis
Technical Analysis: – is a statistical study of price with respect to Time. It is an analysis which tells us what to buy, what to sell, timing the market i.e entry points, exit points.
Fundamental Analysis: – This includes study of balance sheet, Profit & Loss statement, Financial Ratios, Study of Economy at large, Government Regulations, et it tells us which companies are performing well.

Principles of Technical Analysis
- Price discounts everything, everything good bad which has happened or is likely to happen is already factored in the price, e.g. sell on news. As the Gujaratis say it – BHAAAV BHAGWAAN CHE, SAMAY BALWAAAN CHE
- Prices continue to move in a trend till the time trend is not reversed.
- Traders take decisions based on emotions i.e. greed & fear. These decisions are reflected on the charts in the form of patterNs. Just as history repeat itself so does the pattern.
Types of Charts
There are 3 types of charts:
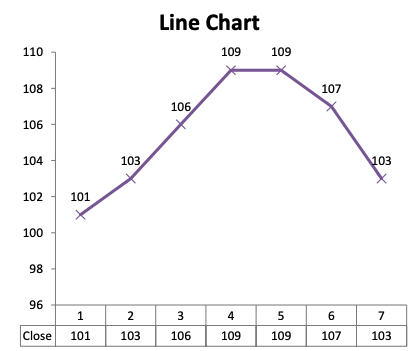
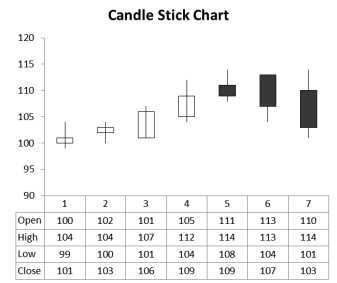
1. Line Charts:– There are 4 Prices which are used to define the price movement for the day i.e. OHLC wherein Open Price, High Price, Low Price, Close Out of this 4 prices closing prices have greater significance. For the line charts will be ploughed on the closing prices with respect to time.
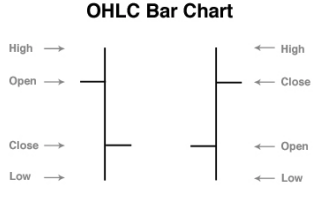
2. Bar Charts:– Bar charts Represents all the 4 prices i.e. OHLC
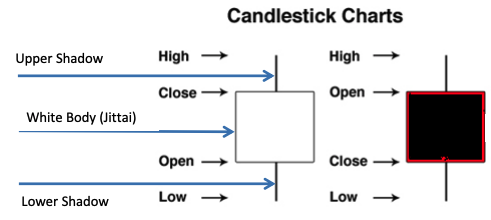
3. Japanese Candle Stick Charts. Candles are lead indicators.
Terminology
- Price Movement is a function of Demand & Supply, when demand outstrips supply price moves up & when supply outstrips demand prices move down.
- Support it’s the point on the chart where there is concentration of latent demand which gets triggered only when prices reaches that point.
- Resistance It’s a point onchart where there is strong over head supply.
- Stop loss:- It is that support which when breached has the potential to reverse the trend of the time frame in which one is trading.
- Target:- It is that resistance point where one needs to book profits, if breached trend is likely to continue.
Trends
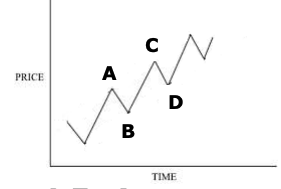
- Uptrend:- When price makes higher tops and higher bottom formation it is in a uptrend.
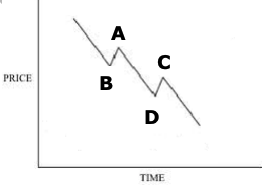
2. Down Trend:- When Prices make lower top’s lower bottoms formation it is a down trend.
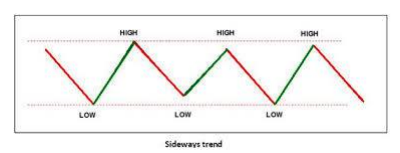
3. Side Ways:- When Prices move in a 2 boundary it is in a side ways trend.
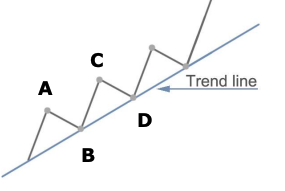
A trend line can be constructed by either joining 2 tops or 2 bottoms. It is one of the most easiest and simplified form of technical analysis, but it is extremely accurate.
Characteristics of trend line
- A trend line acts as a support or resistance. It is dynamic in nature because not only it is a function of price but also function of time.
- When a trend line is breached from below, a bullish breakout occurs and a buy signal is generated. To affirm this buy signal it has to closes above the point of breakout. Vice versa for bearish breakout.
- A trend line when breached reverses it’s roll i.e. the trend line that was acting as resistance was breached will act as support.
- A trend line of higher time frame on chart holds greater significance.
- A trend line which stand the test of time holds greater significance.
- A trend line which has been tested more no of times successfully without getting breached holds greater significance.
- A steeper trend line is easier to breach and hence less significance as compared to flatter trend line.
- In a uptrend a trend line joining higher bottoms (B,D) holds greater significance because it defines the trend. When it is breached a trend reverses.
8. In a downward trend line joining lower tops i.e. (A,C ) defines the trend. When it is breached trend reverses.
