Support and resistance are two foundational concepts in technical analysis. Understanding what they are and how they work is essential to correctly reading a price chart. Technical analysis acknowledges that all stocks rise and fall in price constantly in response to supply and demand.
By zeroing in on movements within a timeframe, they seek to identify patterns. A stock’s price may maintain a support level, below which its price won’t drop. It may also show a resistance level, at which buyers back off.
What is Support?
In a downtrend, prices fall because there is an excess of supply over demand. The lower prices go, the more attractive they become to those waiting on the sidelines to buy the shares.
At some level, demand that would have been slowly increasing will rise to the level where it matches supply. At this point, prices will stop falling. This is support.
Support can be a single price level on the chart or a price zone. In any event, support is an area on a price chart that shows buyers’ willingness to buy. It is at this level that demand will usually overwhelm supply, causing the price decline to halt and reverse.
What is Resistance?
Resistance is the opposite of support. Prices move up because there is more demand than supply. As the prices move higher, there will come a point when selling will overwhelm buying.
This happens for a variety of reasons. It could be that traders have determined that the prices are too high or have met their targets. It could be the reluctance of buyers to initiate new positions at such rich valuations.
It could be for any other number of reasons. But a technician can clearly see on a price chart a level at which supply begins to overwhelm demand. This is resistance. Like support, it can be a level or a zone.
Once an area or zone of support or resistance has been identified, those price levels can serve as potential entry or exit points because, as the price reaches a point of previous support or resistance, it will do one of two things: bounce back away from the support or resistance level, or violate the price level and continue in its prior direction—until it hits the next support or resistance level.
The timing of some trades is based on the belief that support and resistance zones will not be broken. Whether the price is halted by or breaks through the support or resistance level, traders can bet on the direction of the price and quickly determine if they are correct.
If the price moves in the wrong direction (breaks through prior support or resistance levels), the position can be closed at a small loss. If the price moves in the right direction (respects prior support or resistance levels), the move may be substantial.
Real Life Example of Support & Resistance
Now lets look at a real life example of support and resistance spanning out form NIFTY on 12th March 2025.
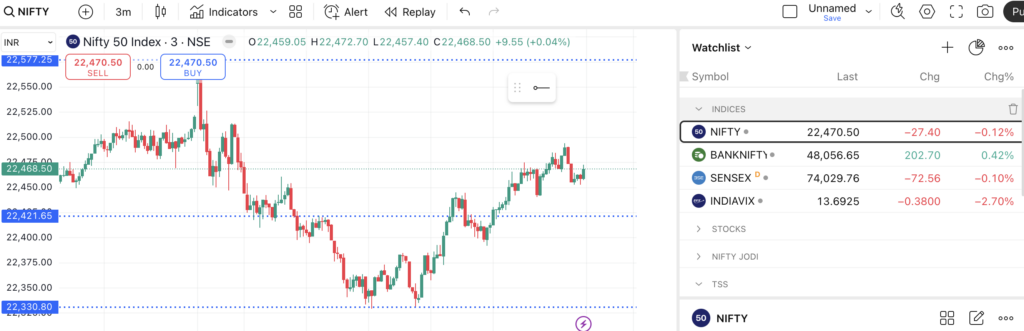
Nifty opened slightly higher at 22,459 compared to previous day and how a small downtrend. Its immediate support level was 22,421 which was support of previous day. However, around 11 am NIFTY broke this support with a big red candle and further continued downwards.
The next support level was 22,330 which was day low and opening of Tuesday 11th March. This time, NIFTY honoured the support level well and did a retrace/U-Turn from support level of 22,330 around 12 pm.
The previous support of 22,330 now became the immediate resistance to overcome. Hence, NIFTY tried to overcome Resistance around 12:20 pm but then faced 3 red candles as seen below. Later, one big GREEN candle helped NIFTY overcome 22,421 barrier and continue the uptrend.
So the day started with 22,421 as the support which became the resistance and by end of day became another support as we enter opening of market on 13th March.

The above shows live working on support and resistance. Understanding this concept is very important to taking trades and positional adjustment to your portfolio. Support and resistance continue to be fundamental elements of the technical analysis universe.